Prefer asking your IDE? Install the Mintlify MCP Docs Server for AgentOps to chat with the docs while you code:
npx mint-mcp add agentopsThe AgentOps app is open source. Browse the code or contribute in our GitHub app directory.
Integrate with developer favorite LLM providers and agent frameworks
Agent Frameworks
AG2
Agno
AutoGen
CrewAI
Google ADK
Haystack
LangChain
OpenAI Agents (Python)
OpenAI Agents (TypeScript)
Smolagents
LLM Providers
Anthropic
Google Generative AI
OpenAI
LiteLLM
Watsonx
x.AI
Mem0
Memori
AgentOps is also available for TypeScript/JavaScript applications. Check out our TypeScript SDK guide for Node.js projects.
@trace decorator (recommended) or manage traces manually for advanced use cases:
The AgentOps Dashboard
Give us a star to bookmark on GitHub, save for later 🖇️)
Session Drilldown
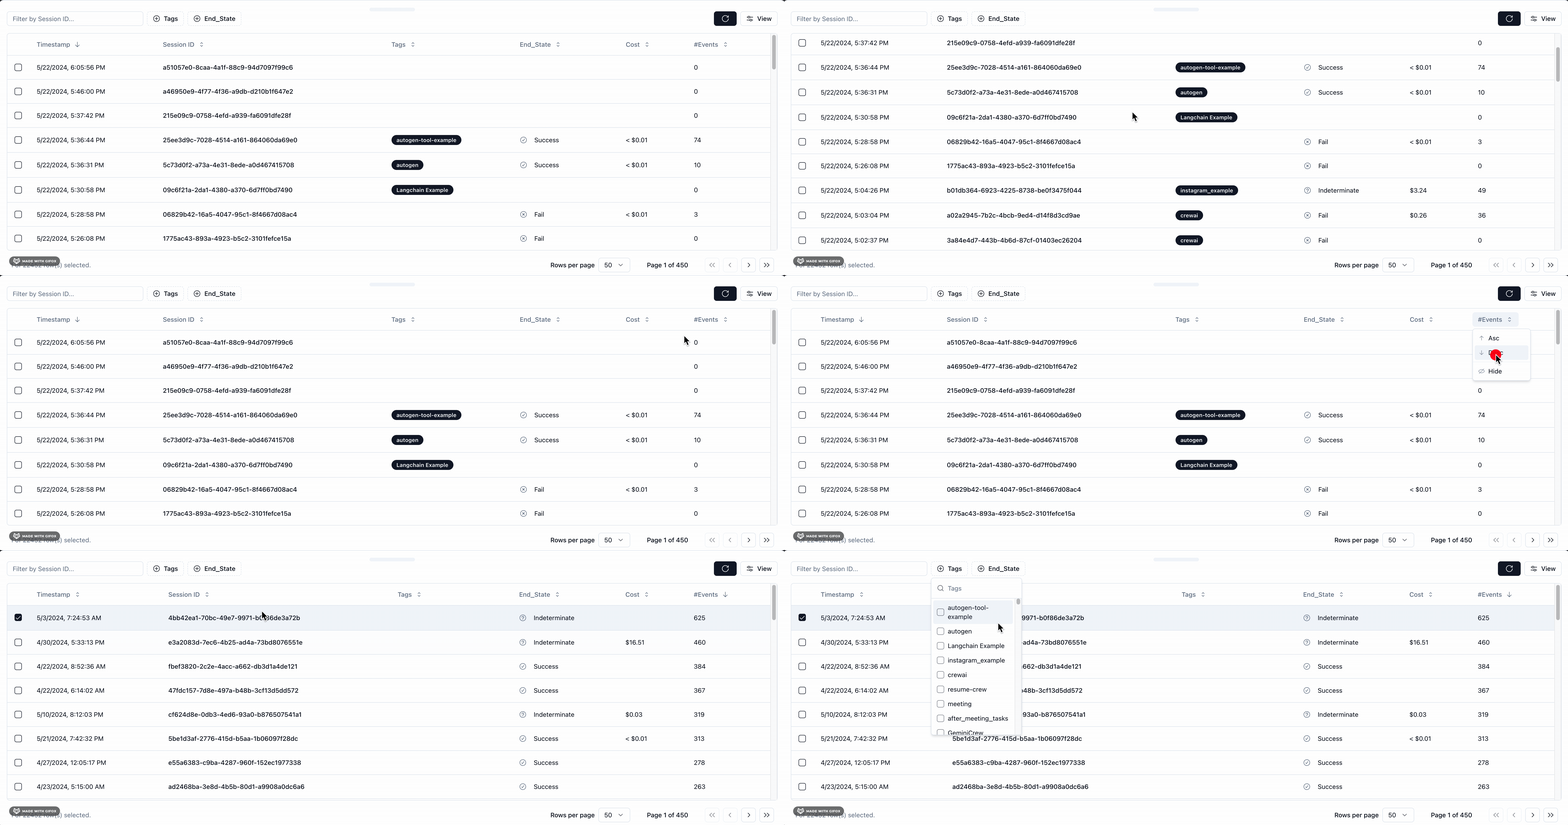
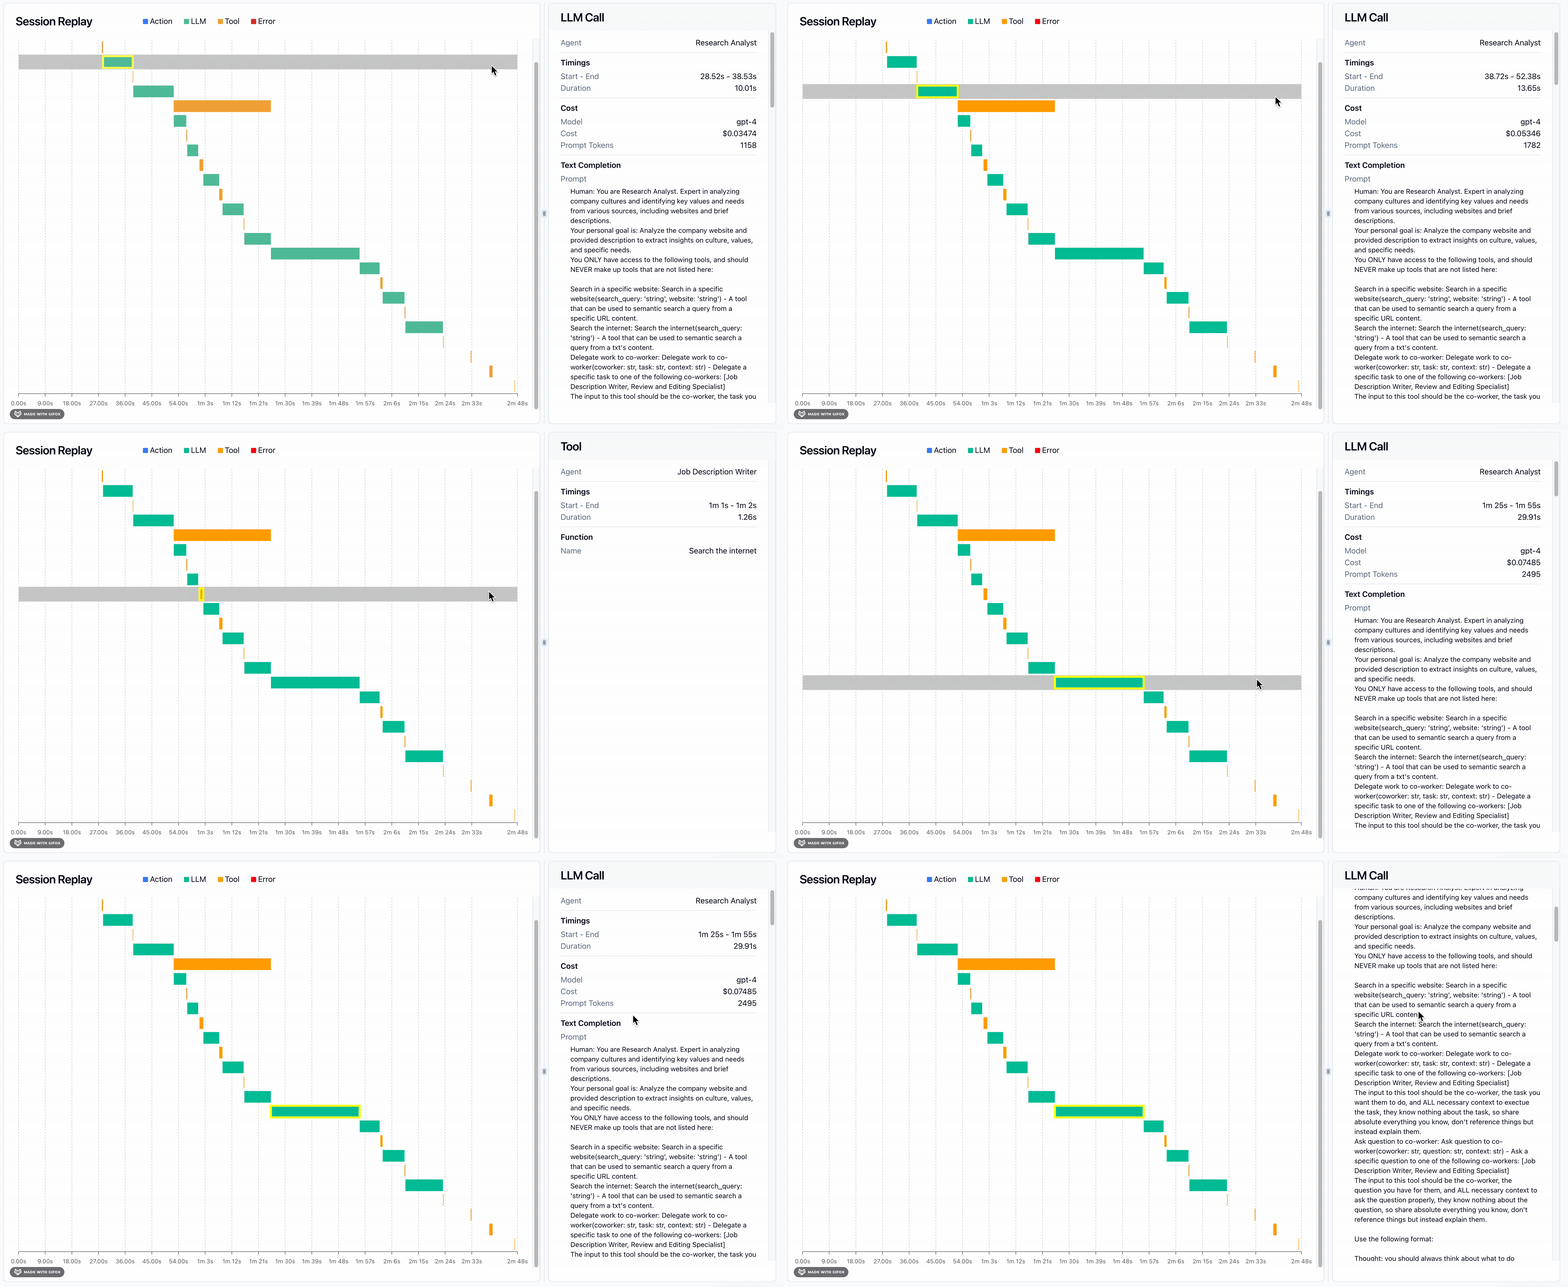
Here you will find a list of all of your previously recorded sessions and useful data about each such as total execution time. You also get helpful debugging info such as any SDK versions you were on if you’re building on a supported agent framework like Crew or AutoGen. LLM calls are presented as a familiar chat history view, and charts give you a breakdown of the types of events that were called and how long they took.


Session Overview
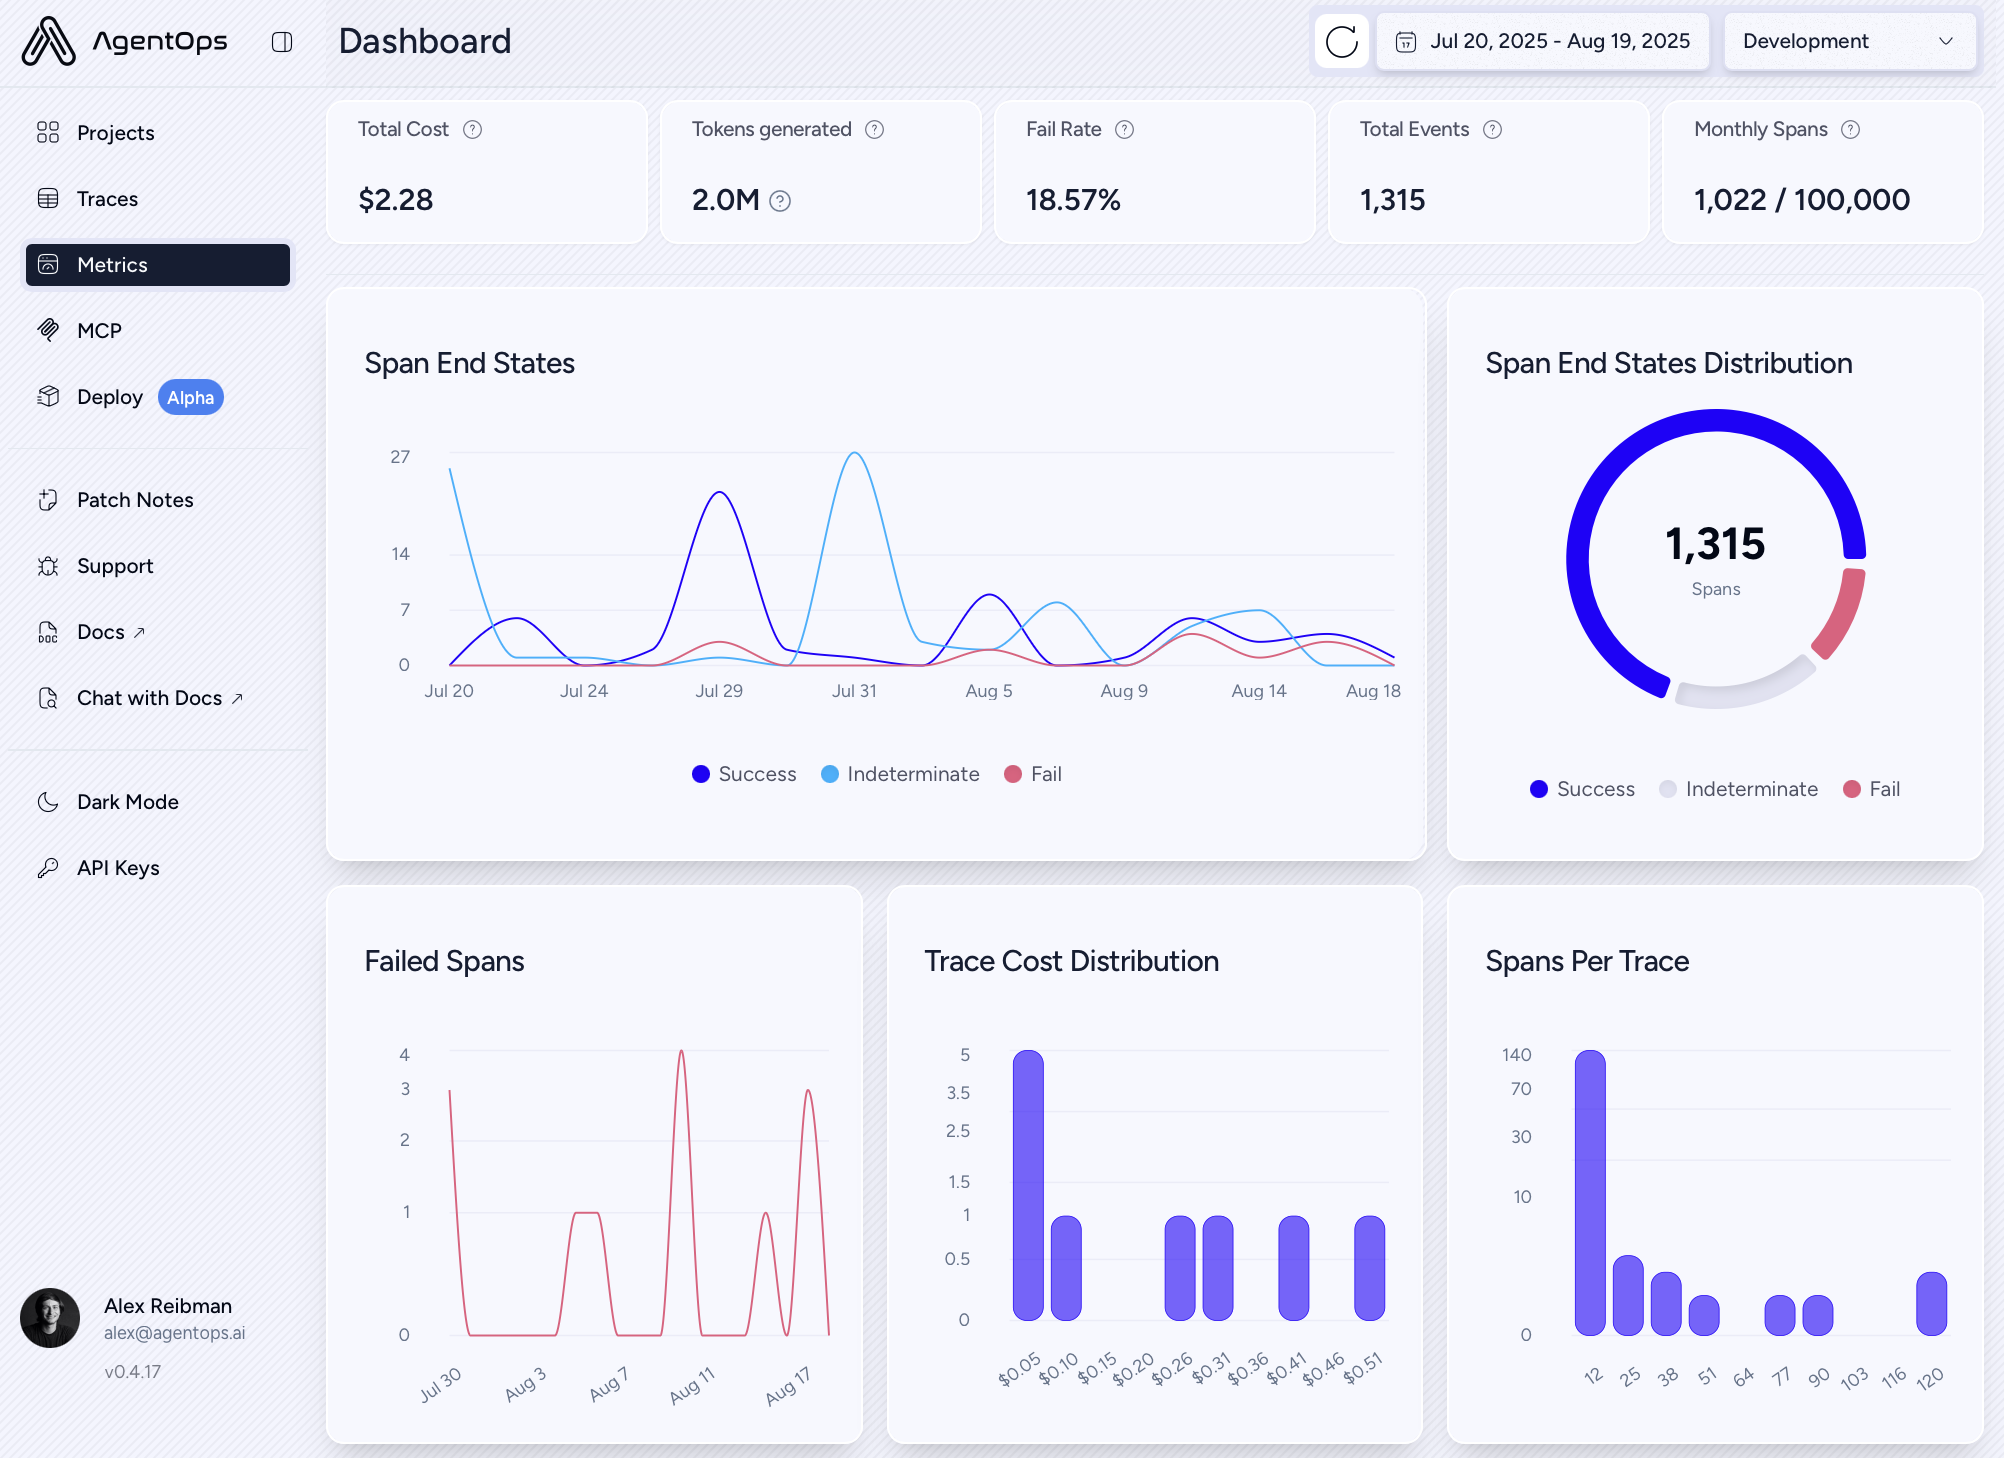
View a meta-analysis of all of your sessions in a single view.

